Furthermore, it is no longer a requirement to have Microsoft Office or a part of Microsoft Office installed to use the Graphical Statistics program as all graphing functions are now built into UniRes.
Better Charting (Graphs)

Charting Types
User selectable charts: Select appropriate graph type or just use default.
The Refresh button
Don't forget to click on the Refresh button when changing the options for the report.
The following statistics can be obtained easily ...
At the top of the Graph window you will see 5 TABs with the following reporting and graphing capabilities ....
Graphing Report Options (Filters)
Time Period
Set the period of time for gathering statistics.
Site Hire refers to "Nights Stay" ie. 1 site for one night.
Occupancy Percentages can be on Gross Sales (All Site Nights sold for all sites and types) or selected types against capacity for the type.
All reports can be printed/previewed exported and emailed as required.
Note. HTML and XLS saves to file may not include graphs in the Preview Tool Bar..
Site Hire Sales
•Time Period
oDays for Month 1 - 31 Days along X-Axis
oMonths for Year Jan - Dec along X-Axis
oYear Comparison Up to 10 years (totals) along X-Axis
Date Range
Selected Month and Year ( - 7 years to + 1 Year)
Period Comparison selectable - compare one month/year against another and graph. (Tick Box)
Gross Occupancy % (Percent)
•Time Period
oDays for Month
oMonths for Year
oYear Comparison
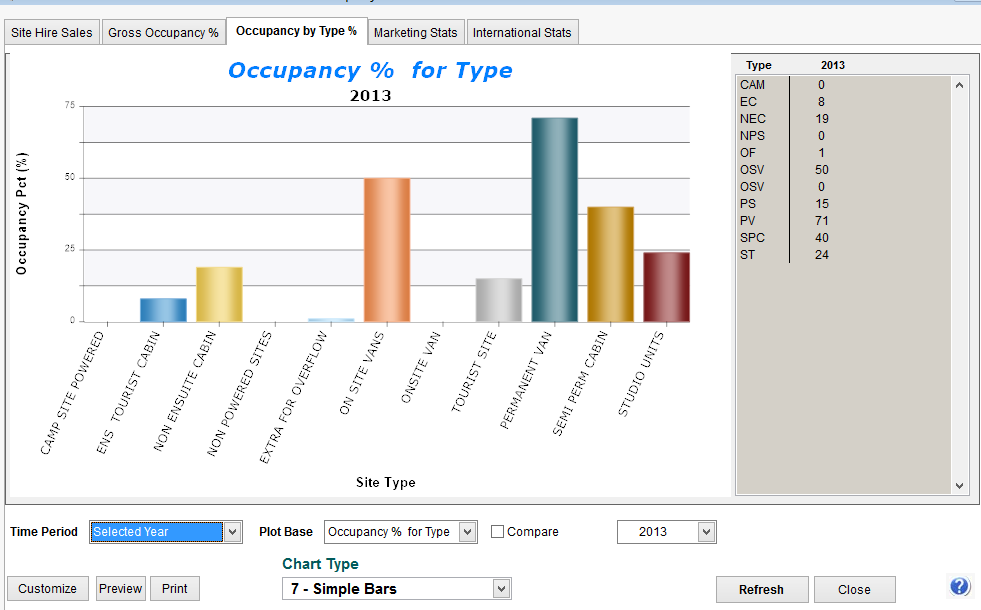
Occupancy by Type %
•Time Period
o Selected Month
o Selected Year
o 1st Financial Quarter (July-Sept current Fin. Yr.)
o 2nd Financial Quarter (Oct-Dec current Fin. Yr.)
o 3rd Financial Quarter (Jan-Mar current Fin. Yr.)
o 4th Financial Quarter (Apr-Jun current Fin. Yr.)
o Jan - March
o April - June
o July - September
o Oct - December
Plot Base
Produce different graphs for ...
Occupancy % for Type
Occupancy % v/s Gross Sales
Occupancy Nights Sold
Created with the Personal Edition of HelpNDoc: Write EPub books for the iPad